
Geophysical Research Letters | Deriving intertidal topography from SWOT data and Sentinel-2 data
Motivation
The accurate and consistent monitoring of intertidal flat topography is essential for understanding and managing these dynamic coastal environments. While satellites offer the most practical tool for global-scale mapping, existing methods—such as the waterline technique and inundation frequency approaches—have some limitations. These methods often rely on a priori elevation data or in-situ tidal measurements, which can limit their accuracy and global applicability, particularly in data-scarce regions.
The launch of the Surface Water and Ocean Topography (SWOT) mission presented a new opportunity. Although primarily designed for observing oceans and inland waters, SWOT's interferometric synthetic aperture radar (InSAR) capabilities offer the potential for direct topographic measurement. Previous studies utilizing SWOT for intertidal mapping still depended on external tidal models or tide gauge records. This study was therefore motivated to develop a novel, self-contained method that leverages SWOT's unique ability to simultaneously observe sea surface height and tidal flat elevation. The goal was to create a robust, satellite-data-only workflow for generating high-resolution (10-meter) intertidal digital elevation models (DEMs) without any dependency on ground-based observations, thereby enhancing the capability for widespread and repeatable coastal monitoring.
Results
This study presents a three-step approach for deriving intertidal topography using satellite data along the coast of Jiangsu Province, China (Figure 1).As illustrated in Figure 2. Step 1 involves creating an inundation frequency map from a time series of Sentinel-2 imagery, which is used to delineate the intertidal boundary. In Step 2, the inundation frequency data are integrated with SWOT observations from each tile, providing the necessary inputs for the construction of the DEMs. Step 3 uses orthometric heights to generate the final tidal flat topographic map by combining all the data processed in Step 2. The resulting topography map is produced at a spatial resolution of 10 m, consistent with the resolution of the Sentinel-2 images.

Figure 1. Long-term trends in TWSA for China and its surrounding region from (a) the downscaled result, (b) the WGHM result (but for the period 2002.04 - 2019.12), (c) the reconstructed result, and (d) the GRACE/GFO result.
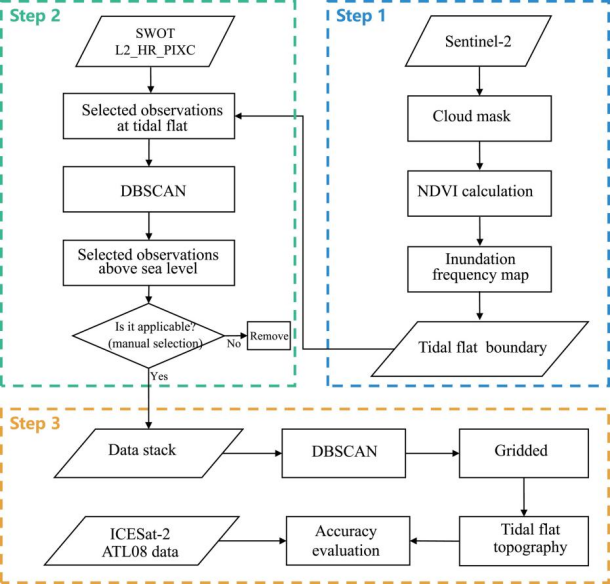
Figure 2. Overview of the tidal flat along the coast of Jiangsu Province, China. Further zoom-in shows the ICESat-2 and Surface Water and Ocean Topography (SWOT) tracks. Colors represent inundation frequency, derived from Sentinel-2 data, which is used to define the intertidal boundary.
Using the data from cycle03pass159 as an example, Figures 3a–3c shows the data processing workflow of Step 2. First, the PIXC observations from pass159 over the tidal flat were filtered (Figure 3a) and processed using DBSCAN. The algorithm identified 382,065 outliers (10.44% of the input data), leaving 3,177,109 valid observations (Figure 3b). The “spots” in the white boxes of Figure 3a were removed as outliers, demonstrating the effectiveness of the DBSCAN method.
Since SWOT observations near the intertidal edge could include sea surface signals, pass 159 extracted SSHs at the time of overflight using three virtual tide gauge stations (1, 2, and 5). Observations above the SSHs (−1.73, −0.60, and −1.29 m for stations 1, 2, and 5, respectively) were retained, while those below were discarded. This process removed 303,055 outliers, resulting in 2,874,054 valid data points (Figure 3c). As indicated by the black boxes in Figure 3b, many observations at the edge of the intertidal (dark blue) were removed, yielding smoother remaining data. For pass 172, SSHs will be derived from three nearby virtual tide gauge stations (1, 3, and 4). After initial processing, 15 useful tiles were selected for the DEM construction.
Two profile lines were established for comparison (both shown in Figure 3d). The PIXC data within 5-m buffers along these profiles are presented in Figures 3e and 3f. Through the DBSCAN processing, most outliers (purple dots) were identified during the secondary clustering phase, with additional marginal outliers (yellow dots) detected in the third step.
A total of 15 tiles (∼26 million observations) were stacked. The stacked data were then processed using the DBSCAN algorithm (Figure 2, step 3), resulting in the removal of ∼2.90 million outliers. The remaining ∼23.2 million observations were used to generate gridded DEMs. We first created a 10 m resolution grid and then calculated the mean within each gridcell. The final DEMs are shown in Figure 3d.

Figure 3. (a–c) Pass 159 of cycle03 is used as an example to demonstrate the data processing for density-based spatial clustering of applications with noise and virtual tide gauge station threshold screening (Step 2, Figure 2). (d) SWOT-derived DEM and panels (e, f) illustrate the process of pixel cloud outlier detection along profile lines (a, b).
Conclusion
The SWOT mission enables continuous spatiotemporal monitoring of sea and inland water. We propose a satellite-only method to derive intertidal topography by fusing SWOT L2_HR_PIXC products and Sentinel-2 imagery, requiring no in situ data. The method was validated over Jiangsu Province's largest intertidal zone (>1,018 km2).
This study proposes a three-step method for generating tidal flat topography. First, an inundation frequency map derived from Sentinel-2 imagery delineates the intertidal boundary. Second, the DBSCAN clustering algorithm and virtual tide gauge data filter observations for DEM construction. Observations within the vicinity of the virtual tide gauges, classified as water, were removed, and the remaining intertidal observations were processed using the density-based clustering method. Finally, orthometric heights integration produces a 10 m resolution DEM, matching Sentinel-2's resolution. Validation against ICESat-2 data showed high accuracy, with RMSEs of 0.24 m (multi-cycle) and 0.41 m (single-cycle). The single-cycle performance confirms SWOT's potential for monitoring intertidal topographic changes. However, this method relies on SWOT data from low tide periods, meaning not all cycles can be used to construct the DEM. More data and refined processing strategies are needed for monitoring tidal flat changes. Additionally, this clustering method may not be suitable for smaller tidal flats, requiring further experimentation in the future.
Citation Format
Sun, M., Feng, W.*, Wang, X., Xu, N.,Peng, F., Chen, X., et al. (2025). Derivingintertidal topography from SWOT data andSentinel‐2 data. Geophysical ResearchLetters, 52, e2025GL117329. https://doi.org/10.1029/2025GL117329
